
Research

Physical climate dynamics, data-driven attribution, and hybrid modelling.

Each project below is an ongoing thread of work. I've included methods, datasets, headline results, and links to the code and papers where they exist.

Figure. Monthly maps (Dec–Jul) of sea-ice thickness along the Labrador coast comparing Canadian Ice Service observations with CESM-HR ensemble-mean output.

2022 – 2024 · MSc thesis, McGill University

Projection of sea-ice conditions in Nunatsiavut (Labrador)

Projected changes in landfast and pack ice along the Nunatsiavut coast by combining high-resolution CESM output with Canadian Ice Service in-situ observations, and built a lightweight ERA5 degree-day model of sea-ice onset and melt validated against thickness records.

Methods

  • · CESM-HR climate-model diagnostics
  • · Model–observation bias analysis
  • · ERA5 degree-day sea-ice onset/melt model
  • · Statistical validation against ice-thickness data

Datasets

  • · CESM-HR
  • · ERA5
  • · Canadian Ice Service (CIS) observations

Selected results

  • Integrated CESM-HR output with CIS in-situ records to characterise regional bias in ice onset and duration.
  • Built and validated a simple degree-day model reproducing observed sea-ice onset and melt seasons in Nunatsiavut.
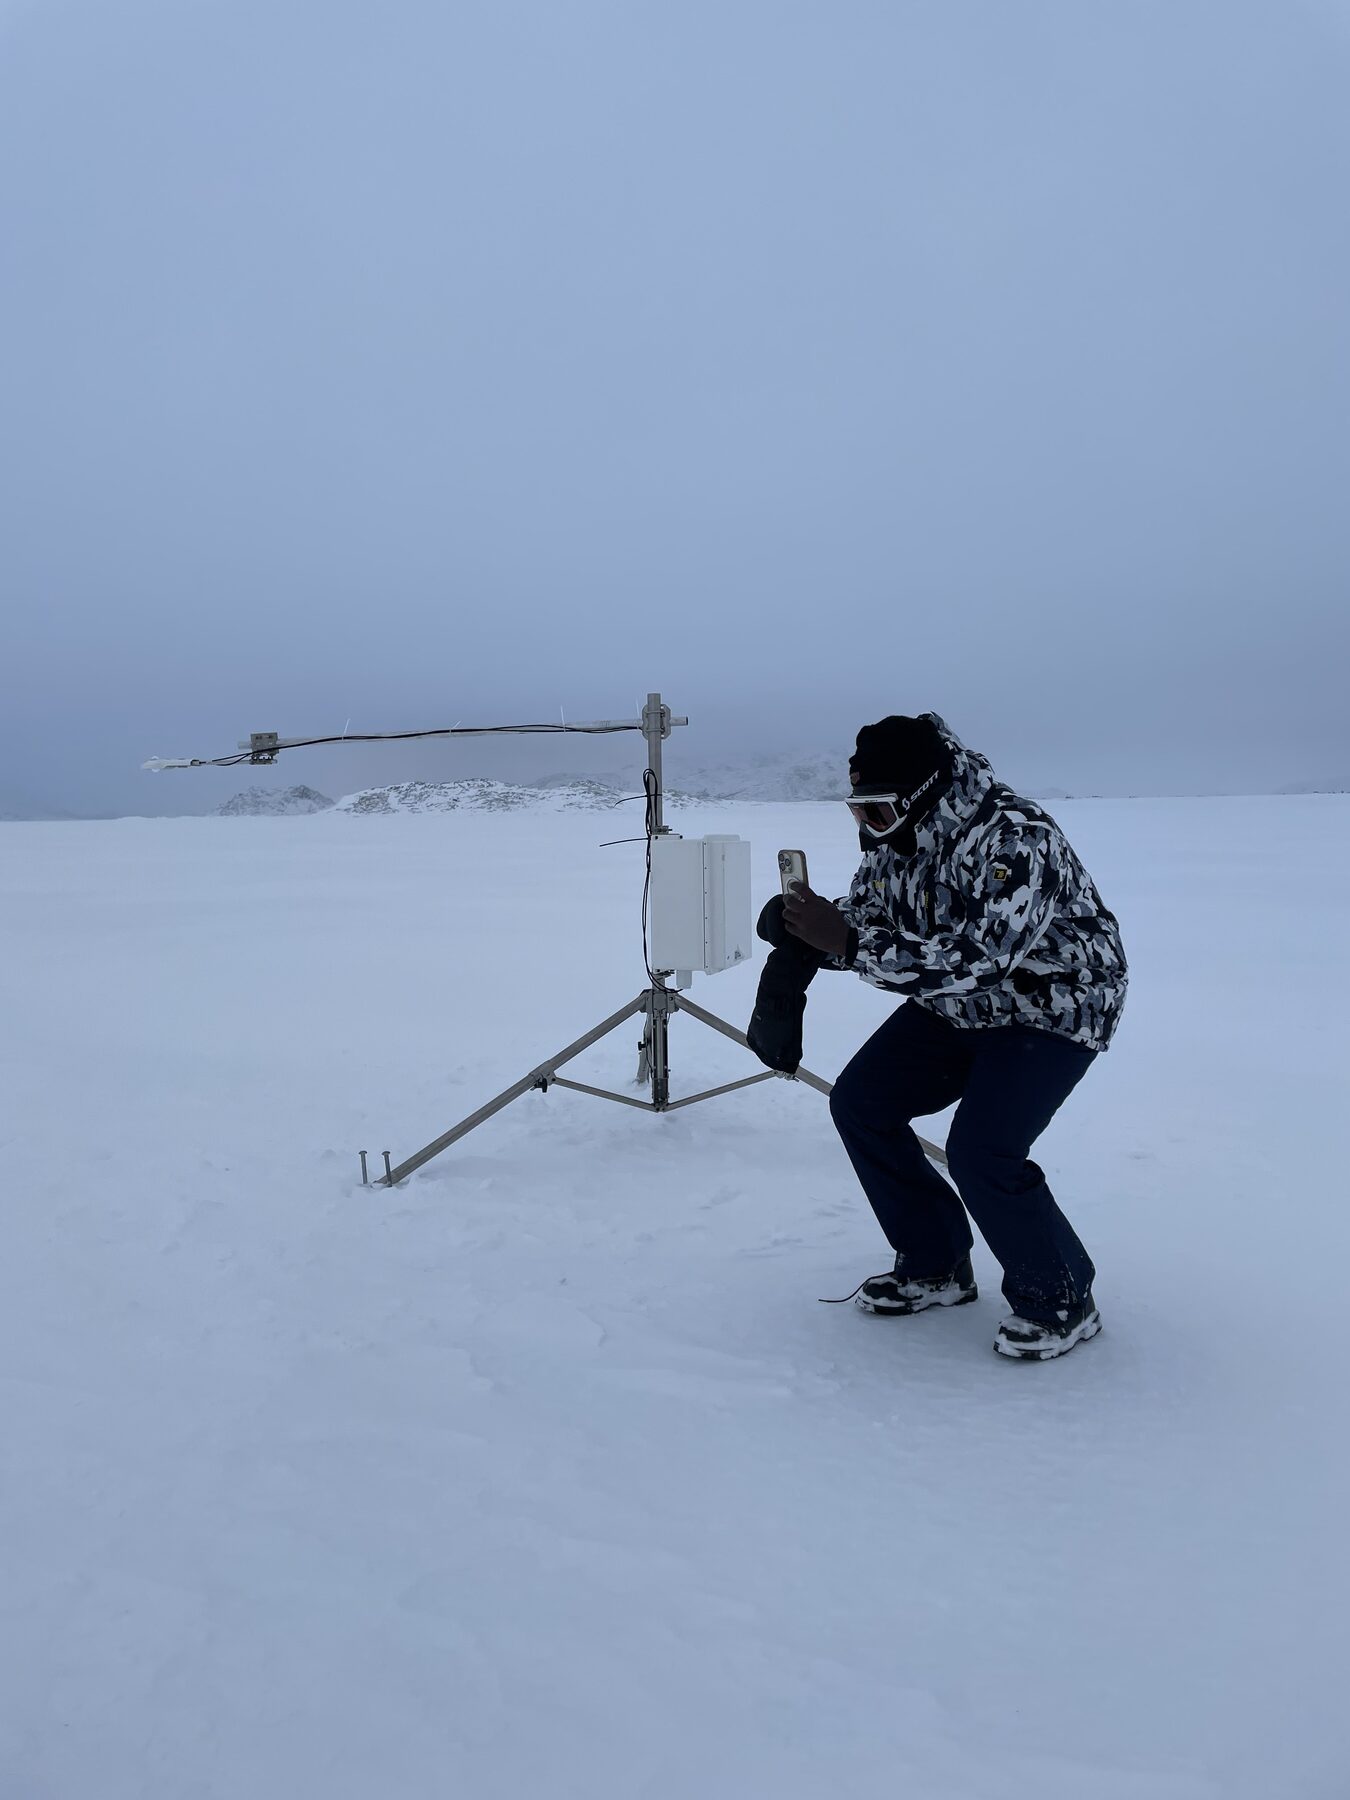
Figure. Maps of Arctic sea-ice concentration means and CMIP6 bias against HadISST and OSTIA for the 10th and 90th percentiles (1982–2014).

2024 · Environment and Climate Change Canada

CMIP6 sea-ice concentration and thickness assessment

Evaluated CMIP6 sea-ice concentration and thickness against observational datasets using Python-based climate data workflows, supporting model diagnostics and inter-model comparison at ECCC.

Methods

  • · CMIP6 model evaluation
  • · Bias metrics and skill scores
  • · Large geospatial data processing with Xarray / Dask
  • · Cartographic visualisation with Cartopy

Datasets

  • · CMIP6
  • · NSIDC passive microwave
  • · Observational sea-ice thickness

Selected results

  • Quantified inter-model spread in Arctic sea-ice concentration and thickness against satellite records.
  • Delivered reusable Python workflows for climate diagnostics adopted by the research team.

Figure. Monthly maps of malaria vectorial capacity across Ghana from January through December, showing the seasonal cycle across the country's agro-ecological zones.

2021 · BSc thesis, KNUST

Climate change and malaria vectorial capacity in Ghana

Investigated how temperature change affects the vectorial capacity of Anopheles mosquitoes across the agro-ecological zones of Ghana, combining climate data analysis with statistical transmission modelling. Contributed to a peer-reviewed study on warming and mosquito lifespan.

Methods

  • · Climate–disease statistical modelling
  • · Zonal comparative analysis
  • · SIR-type disease-transmission modelling
  • · Geospatial visualisation

Datasets

  • · Ghana Meteorological Agency station data
  • · Reanalysis temperature fields
  • · Entomological survey data

Selected results

  • Estimated malaria vectorial capacity across Ghana's agro-ecological zones under changing temperature regimes.
  • Winner of the KNUST Final-Year Poster Presentation (2021).
Frozen coastline near Nain, Nunatsiavut, with snow-covered hills under overcast winter sky.

Fieldwork · February 2024

Nain Field Campaign — Nunatsiavut, Labrador

A February 2024 campaign on the sea ice outside Nain, in support of my M.Sc. research at McGill. I installed and maintained an automatic weather station, visible and infrared cameras, and a radiometer, and worked with researchers and local partners to collect in-situ observations that anchor satellite, ERA5, and CESM comparisons for regional sea-ice projections.

Location

Nain, Nunatsiavut, Labrador

Context

M.Sc. research, McGill University